Center for Community Support and Development Studies and United Nations Development Program
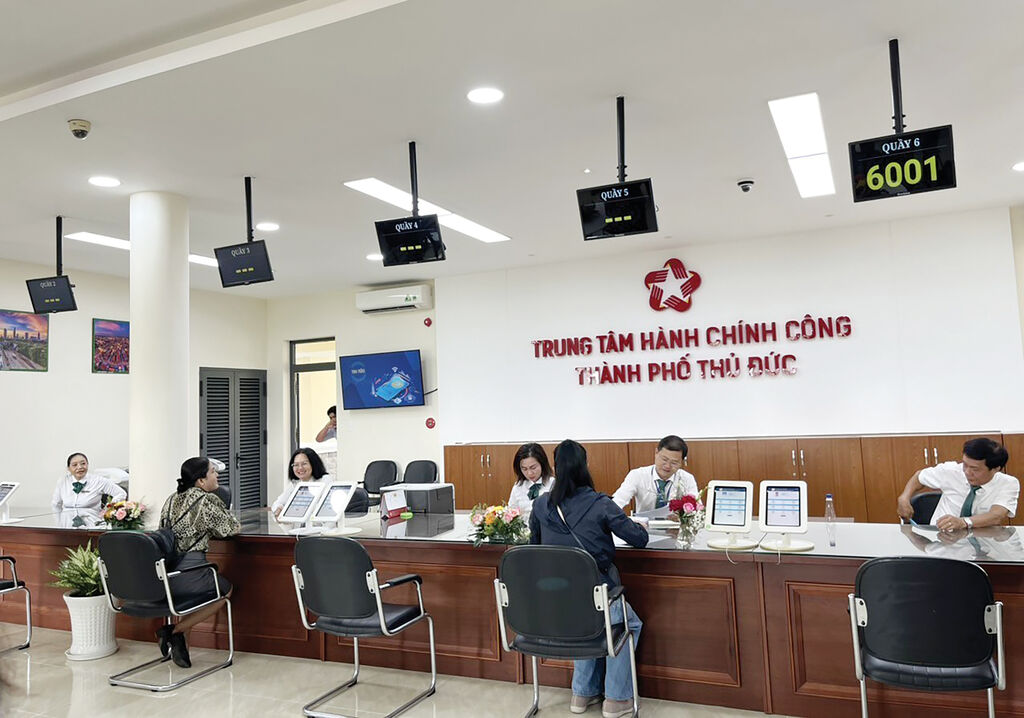 |
| The Public Administration Center of Ho Chi Minh City’s Thu Duc city__Photo: Hoang Tuyet/VNA |
Introduction
The 15th edition of the Provincial Governance and Public Administration Performance Index (PAPI) Report,[1] which captures citizen perspectives of local governance in 2023, shows progress in anti-corruption and e-governance but a backsliding in transparency. It also reveals that the situations of individual, household and national economy were the top concern for citizens in 2023.
This article is an excerpt from the 2023 PAPI Report, which was officially launched on April 2, and presents key findings from PAPI citizen surveys regarding citizens’ assessment of governance and public administration performance at the national level and the issues of citizens’ greatest concern in 2023. The Report records the voices of 19,536 respondents from across Vietnam, who shared their perspectives of local government performance in governance, public administration and public service delivery in 2023. These respondents were randomly selected to represent the views of a broad spectrum of Vietnamese citizens, aged 18 years and above, from various demographic backgrounds.
This article starts by highlighting national trends in all eight PAPI dimensions from 2020 to 2023 to compare how they shifted from the last year of the 2016-21 government term to the middle of the current term. Then it reflects citizens’ issues of most concern in 2023 and over the past seven years. As 2023 was a challenging year for Vietnam in terms of economic growth, this article further examines how citizens perceived their household and national economic situations. It concludes by summarizing key findings of immediate interest for different stakeholders involved in governance and public administration in Vietnam. It also points to policy implications relevant for policymakers and practitioners in Vietnam in 2024 and beyond.
Governance and public administration performance in 2023: a mixed picture
This section provides a summary of the key findings and implications from the analysis of the 2023 PAPI survey results, with a focus on the performance of national level governance and public administration from a comparative perspective. First, it brings forward time-series comparisons of dimensions consistently measured from 2020 to 2023. Second, it examines in greater detail the two dimensions of Control of Corruption in the Public Sector and Transparency in Local Decision-making which are critical to overall citizen satisfaction with government performance at different levels.
Figure 1 provides an overview of the changes in the eight PAPI dimensional scores since 2020. It illustrates that 2023 was a year of mixed progress in these eight dimensions, as seen in the previous two years. Notably, from 2022 to 2023, the two dimensions of Control of Corruption in the Public Sector and E-Governance showed improvements. The two dimensions of Public Service Delivery and Environmental Governance remained largely unchanged. However, the four remaining dimensions, Participation at Local Levels, Transparency in Local Decision-making, Vertical Accountability Toward Citizens, and Public Administrative Procedures, showed declines.
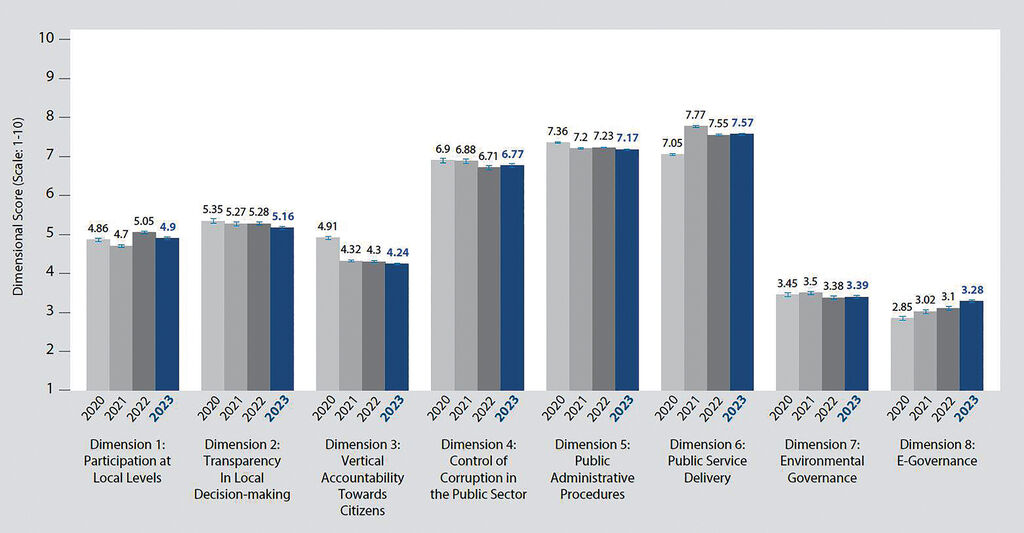 |
| Figure 1: Overall changes in PAPI dimensional scores over time, 2020-23 |
Control of Corruption in the Public Sector saw slight improvements in 2023
Each year, the PAPI Report addresses the Control of Corruption in the Public Sector indicators in detail. It does so because corruption is possibly the issue of greatest concern from both the Party’s and citizens’ perspectives. Although the Party’s national anti-corruption campaign has accelerated since the COVID-19 pandemic two years ago,[2] the Party recently acknowledged that corruption is still a constant problem and reflects the poor morality of public officials.[3] In the meantime, as noted in previous PAPI reports, Control of Corruption in the Public Sector is the dimension most strongly correlated with PAPI’s Overall Satisfaction with Government indicator from citizens’ perspectives. It is also a dimension that has remained static since 2019.
This dimension’s sub-dimensions are Limits on Corruption in Local Government, Limits on Corruption in Public Services, Equity in State Employment, and Willingness to Fight Corruption. As Figure 1 shows, there was a slight improvement in this dimension compared to 2022. Looking within the components of this dimension, Figure 2 paints a mixed picture of citizens’ assessment of the public sector’s performance in anti-corruption during the year. While there were slight improvements in the sub-dimensions on Limits on Corruption in Local Government, Limits on Corruption in Public Services and Equity in State Employment, there was a slight drop in the Willingness to Fight Corruption sub-dimension.
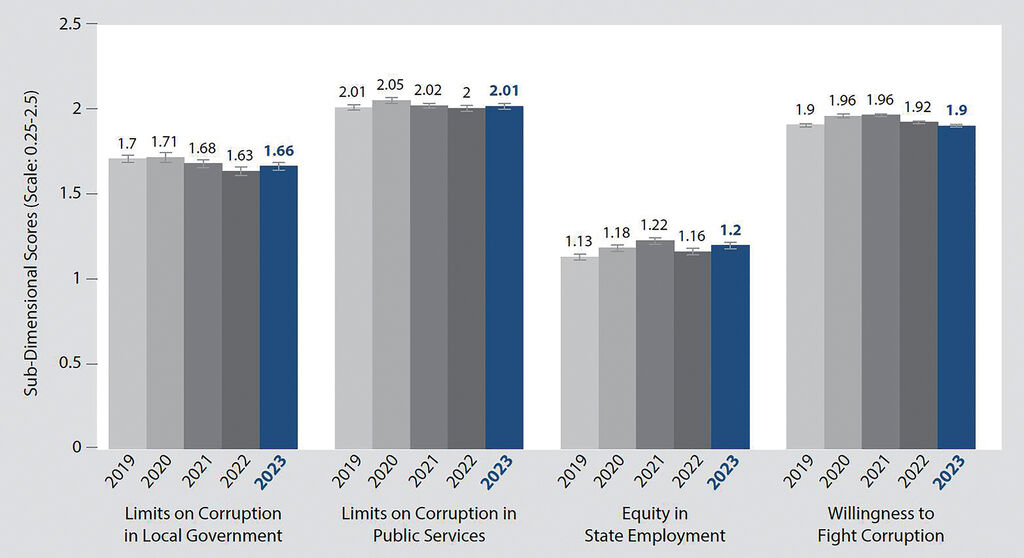 |
| Figure 2: Changes in Control of Corruption in the Public Sector sub-dimensions, 2019-23 |
The PAPI survey asks a series of questions regarding respondents’ perceptions of corruption from their everyday interactions with local governments. As Figure 3 shows, the proportion of respondents who believed that connections with authorized persons in the state apparatus are important to get a public office position (i.e., land registrars, justice officers, police officers, primary school teachers, and People’s Committee staff at commune level) has almost continuously dropped since 2016 when the anti-corruption campaign accelerated. Still, Figure 3 shows a high level of citizen concern about the importance of personal connections required when applying for one of the five positions, with the percentages of respondents seeing nepotism as the key success factor ranging from 56.17 to 62.53 percent. In particular, the highest levels of concern about nepotism are focused on land registrars and justice officers, with more than 62 percent of all respondents saying connections were important.
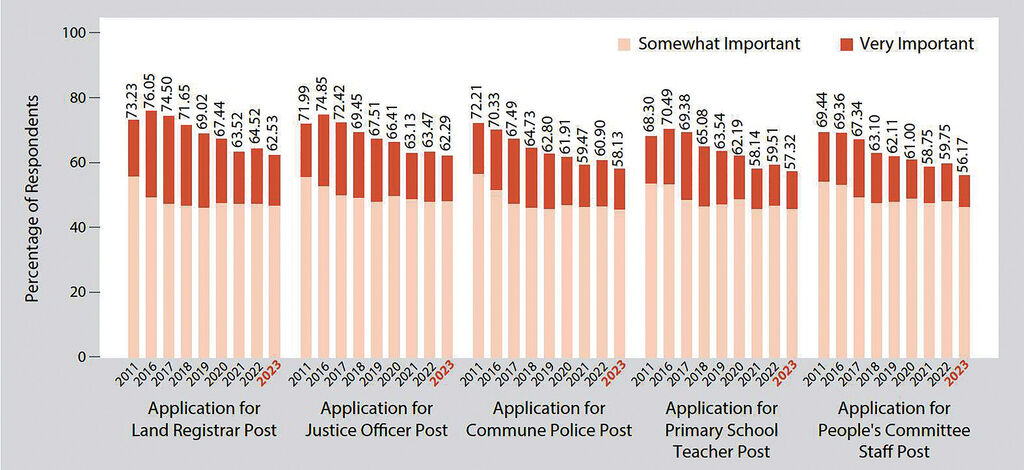 |
| Figure 3: Importance of connections for different civil service positions, 2011-23 |
Citizens’ perceptions of the eight different types of corruption assessed by PAPI show improvements. Those indicators are about whether respondents witness or experience bribery for ease in civil court rulings, avoidance of environmental regulations, state employment, better public health service, or teachers’ favoritism for children at primary schools; for greasing the wheels when handling land-use rights certificate (LURC) procedures, or construction permit procedures, and public officials’ diversion of state funds for private interest. As shown in Figure 4, citizens perceived five types of corruption across as declining over the past eight years. Still, in 2023, more respondents (36.7 percent) perceived that informal payments were needed to secure a job in state employment than in 2021, when viewing the change for every two years. The good news is the percentages of those who anticipated that payment of a bribe was necessary to get a LURC and for better care at public district hospitals were slightly lower in 2023 than in the previous two years. Also, the percentages of those who perceived that bribe for teacher’s favoritism and avoidance of environmental regulations decreased.
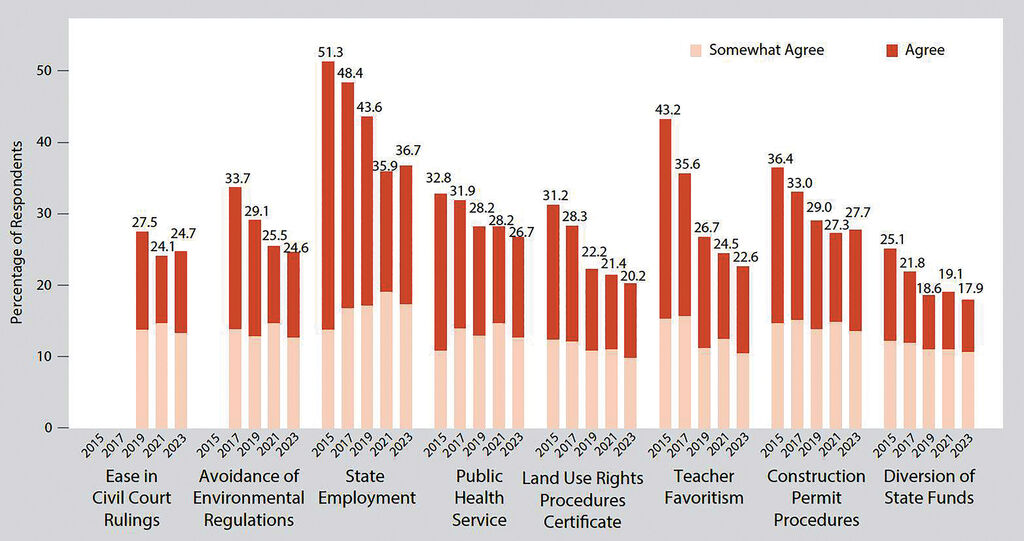 |
| Figure 4: Corruption as perceived by citizens biannually, 2015-23 |
These trends are mostly backed up by experiential indicators that use more sophisticated and complex survey techniques. Each year, PAPI uses state-of-the-art survey techniques to ask citizens sensitive questions about bribery without requiring them to directly answer whether they engaged in such practices. The numbers shown in Table 1 result from estimating the number of citizens that engage in giving a bribe when applying for LURCs, obtaining better treatment at public district hospitals, or obtaining teachers’ favoritism for children at public primary schools. They reveal that the incidences of bribery for LURCs and better healthcare results shrank in 2023 compared to the previous two years, in line with previous findings. Regarding informal payments for teachers’ favoritism, there was less movement.
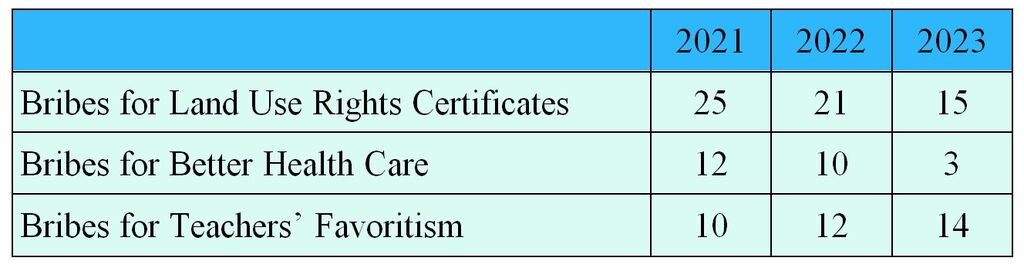 |
| Table 1: Changes in experiences with bribery, 2021-23 (percent) |
Note: The percentages come from different numbers of activities between the control and treatment groups in a “list” experiment question.
Overall, most indicators measuring the public sector’s performance in control of corruption showed an improvement in anti-corruption efforts in 2023. This may be a result of impacts of the anti-corruption campaign underway since 2016.
Transparency in Local Decision-making saw a decline in 2023
Transparency in local decision-making is critical as it can reduce corruption by exposing potential malfeasance. Citizens can only hold local officials accountable if they have access to accurate information. Additionally, transparency facilitates participatory governance as citizens are better able to offer feedback on budget and land use if they are informed about current government plans and activities in these areas. Therefore, PAPI measures transparency in local decision-making to inform policymakers and practitioners of local governments’ performance in specific public-facing areas that citizens have a right to know, discuss and verify as provided in the 2016 Law on Access to Information and the 2022 Law on Grassroots Democracy Implementation.
Figure 5 shows the overall trends in the dimension of Transparency in Local Decision-making. It reveals that the biggest source of dimensional score declines in 2023 was reduced transparency in commune budget and expenditure, from 1.4 points in 2019 to 1.32 points in 2023. Similarly, transparency in poverty lists also provided downward pressure from 1.78 points in 2019 to 1.65 points in 2023. On a positive note, the Access to Information sub-dimension posted a rise from 0.80 to 0.86 on a scale of 0.25 to 2.5 points. Meanwhile, there was no change in the Transparent Land Use Plans/Price Frames sub-dimension over the past two years, as the 2023 score remained at 1.33 points, a positive change from 1.3 points in 2021.
Publicizing and being accountable for budgets and expenditure at the grassroots level are essential mandates for commune-level governments, as required not only by the 2016 Law on Access to Information but also the 2015 Law on the State Budget and the 2022 Law on Grassroots Democracy Implementation. Open budgets may reduce corruption by increasing the likelihood that disparities in budget and actual expenditures can be identified. Making local government public officials accountable for state budgets and expenditure will help prevent embezzlement.
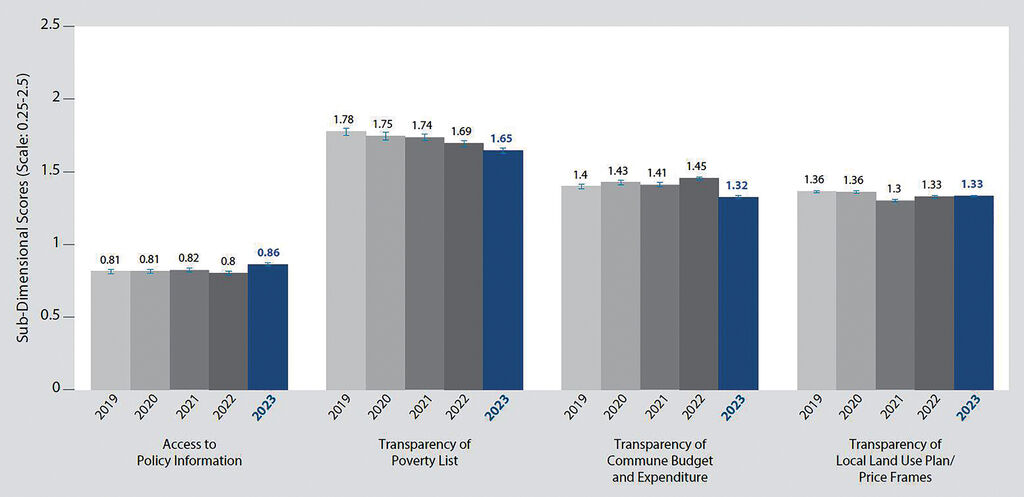 |
| Figure 5: Changes in Transparency in Local Decision-making scores, 2019-23 |
With Figure 5 showing a drop in the Commune Budgets Transparency sub-dimension, Figure 6 reveals the primary reason: far fewer respondents reported that commune governments disclosed the commune budget and expenditure worksheets for residents to be informed in the past 12 months. Between 2018 and 2022, 44 to 47 percent of the respondents said the worksheets were publicly available within each year. This percentage tumbled to 38.9 percent in 2023, the lowest since 2016.
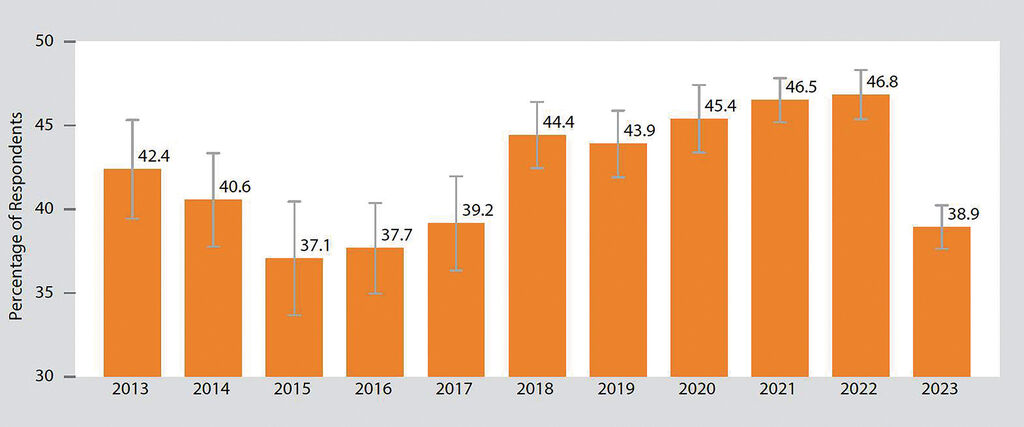 |
| Figure 6: Disclosure of commune budget and expenditure lists, 2013-23 |
Regarding poverty lists transparency, the decline reflects a trend evident since 2019. As Figure 7 shows, in 2019 only 30 percent of citizens said there were eligible households missing from the list compared to 37.6 percent in 2023. This view is highest among those at the lowest end of the income scale, as tracked in the PAPI surveys.
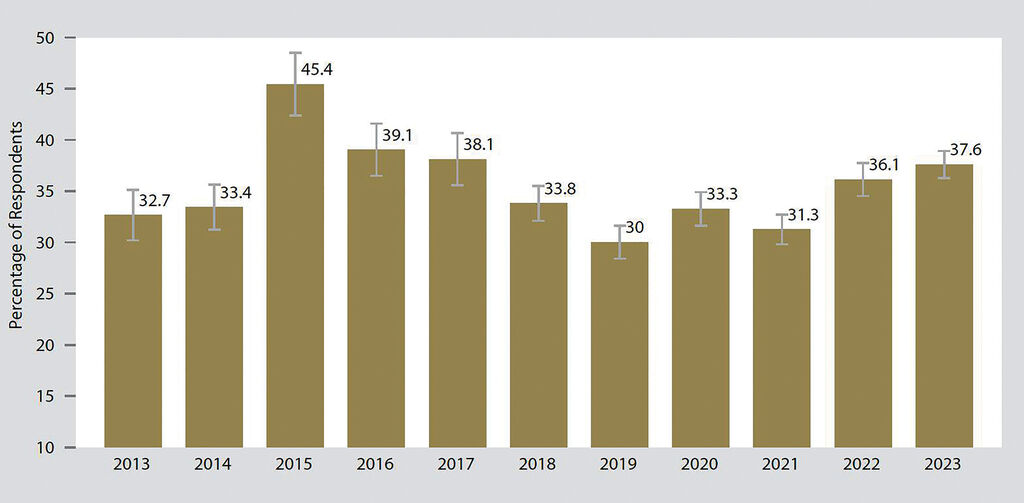 |
| Figure 7: Eligible households missing from local poverty lists, 2013-23 |
As Table 2 further elaborates, 43.57 percent of those with the lowest amount of household monthly income, as captured in the PAPI surveys, perceived that suitable people were not on the poverty list.[4] Addressing this issue is important for improving overall satisfaction with government. Deeper regression analysis shows that those spotting perceived errors in poverty lists have a much lower level of satisfaction with government, particularly village and commune leaders.
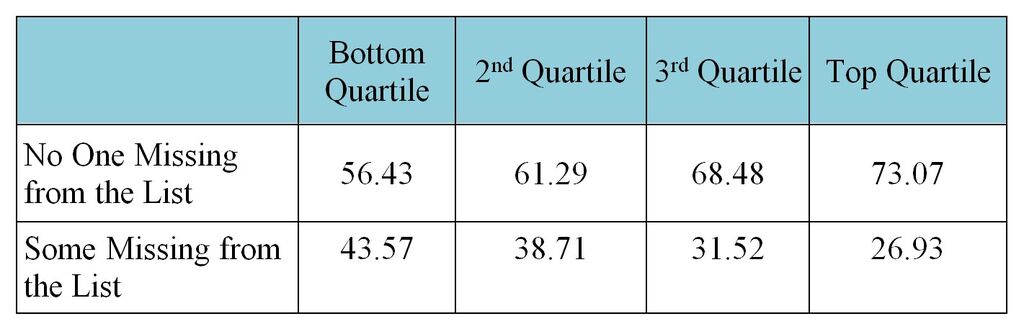 |
| Table 2: Perception of missing households by income (percent) |
Note: The bottom quartile includes those with households making less than VND 6 million per month based on the PAPI responses, the second, VND 6-12 million per month, the third, VND 12-20 million per month, and the top quartile, more than VND 20 million per month. The results are from question d202a, which asks whether there are poor households in the village/residential group who are missing from the list of poor households eligible for special subsidies.
Top 10 issues of greatest concern in 2023 and trends in citizen priorities
This section captures citizens’ assessments of household economic conditions in 2023, also with a time-series perspective from 2013. The findings are important as they provide context to analyze the shifts in important PAPI scores in this report. They also provide a snapshot of which key policy priorities the central and local governments should address in the following year from citizens’ perspectives.
Each year since 2015, the PAPI survey asks citizens an open-ended question to assess the issue of greatest concern they think the national government should prioritize in the coming year. This question also allows policymakers to identify issues for remedial action. Figure 8 displays 10 issues with the largest percentages of respondents prioritizing issues that require the State’s action. As it shows, poverty, employment and economic growth were the top three, reflecting the economic and employment challenges Vietnam faced in 2023. Among these, poverty and hunger was cited by 22.39 percent of all respondents as the most important issue the State should address, while jobs and employment were selected by 12.79 percent of respondents. Economic growth was third at 9.2 percent. Public services in the form of roads and education came next at 6.85 and 6.38 percent, respectively. Corruption ranked sixth at 5.25 percent. The concern about environmental pollution was outside the top 10.
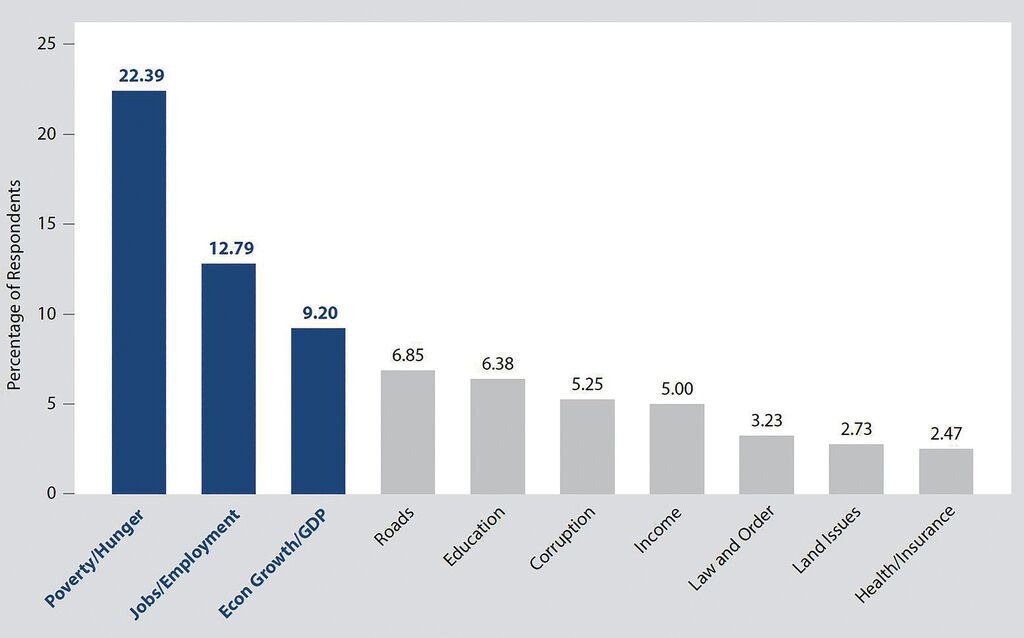 |
| Figure 8: Top ten important issues from citizens’ perspectives in 2023 |
In terms of the changes in issues of greatest concern from 2022 to 2023, as Figure 9 shows, the largest rise was in the percentage of respondents selecting jobs and employment as a top priority issue, with a 2.7 percentage point increase. Next came income and education, with 1.3 and 1.1 percentage points greater than 2022, respectively. Corruption, on the other hand, dropped by 1.1 percentage points from 2022, reflecting the trend seen in Control of Corruption in the Public Sector as shown in Figure 1. Concerns about health and health insurance diminished most significantly from 2022, with a 2.39 percent drop.
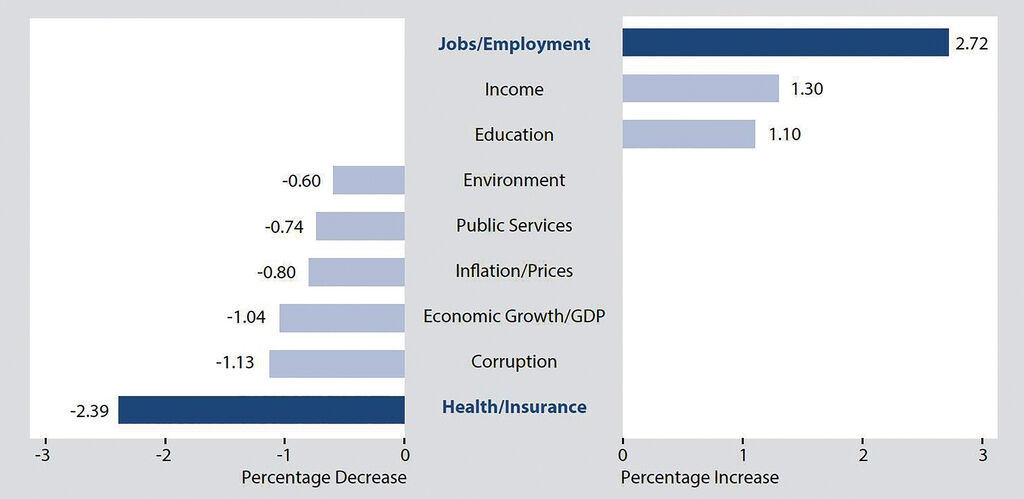 |
| Figure 9: Changes in issues of greatest concern, 2022-23 |
Figure 10 shows the trend in citizen priorities from 2015, when the question was first asked, to 2023. As it shows, poverty was consistently the top concern, except 2021 when health concerns took over at the height of the COVID-19 pandemic. The figure also shows that environment and health concerns dropped substantially since their peaks in 2016 (after the mass fish deaths in north-central Vietnam in 2016[5]) and 2021 (during the pandemic), respectively.
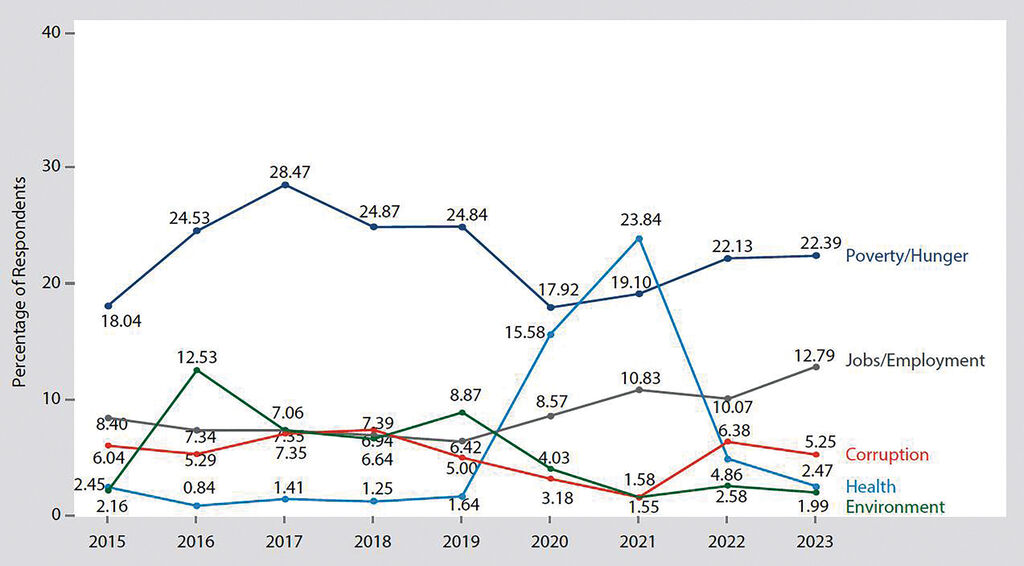 |
| Figure 10: Changes in selected issues of greatest concern, 2015-23 |
Each year, the PAPI survey asks respondents how they rate their current household economic situation, how it has changed compared to five years ago, and how they assess Vietnam’s economic situation at the time they are asked the question. As shown in Figure 11, more respondents indicated that their household economic situation was poor or very poor in 2023 compared to the survey results between 2017 and 2022. The only exception was 2021 during the depths of the COVID-19 pandemic.
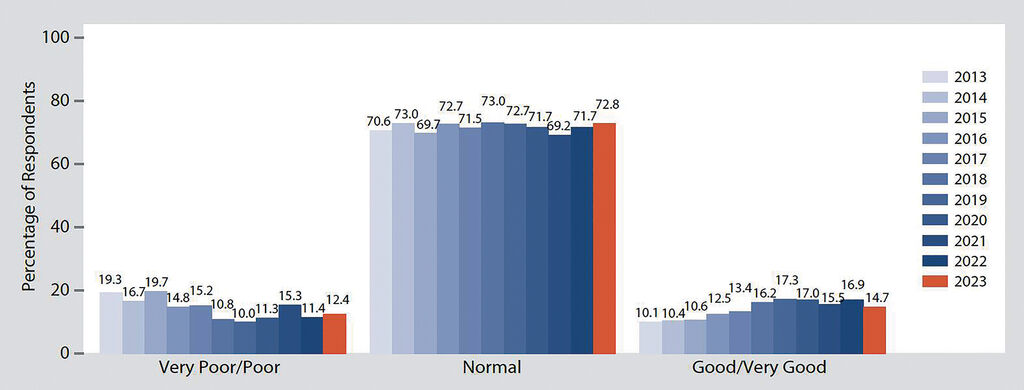 |
| Figure 11: Citizen assessment of current household economic situation, 2013-23 |
More concerning are citizens’ perceptions of the relative change in their economic situation compared to five years ago. Figure 12 shows that the highest ever percentage of respondents (26 percent) recorded by PAPI said their household economic situation (in 2023) had become worse compared to five years ago, except 2021 at the peak of the pandemic.
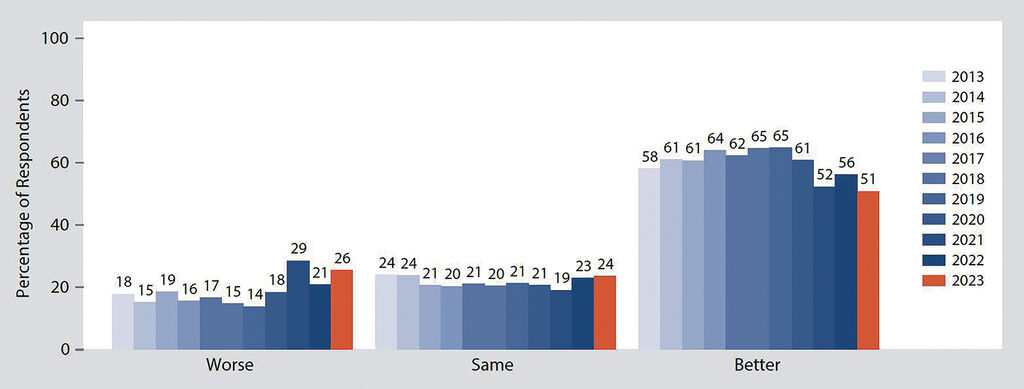 |
| Figure 12: Change in household economic conditions in past five years, 2013-23 |
With citizens’ assessment of the national economy, as Figure 13 illustrates, there was greater pessimism among respondents, which reflected concern over Vietnam’s economic situation in 2023. Aside from 2021, the year 2023 saw fewer respondents (54.4 percent, nearly 12 percent lower than in 2022) perceiving that the national economy was “good” and more respondents (13.6 percent) saying it was “bad” since 2018 when this question was first asked.
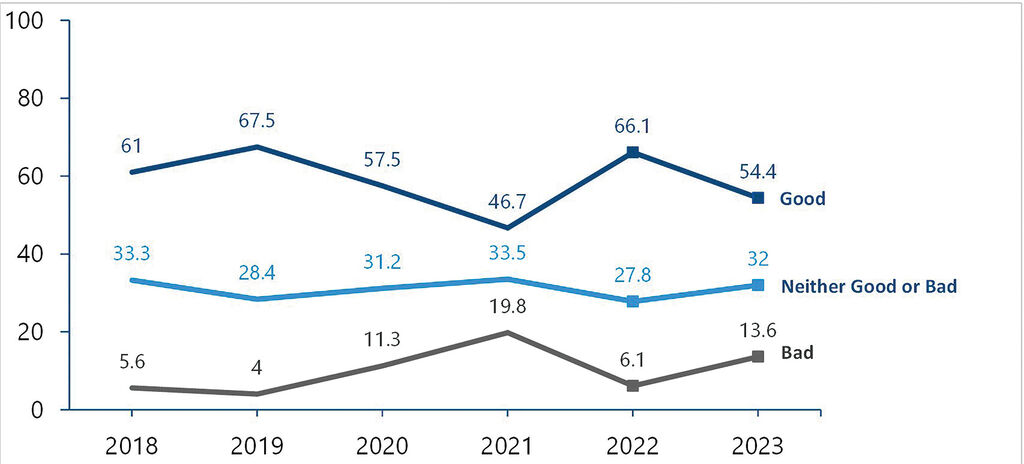 |
| Figure 13: Citizens’ assessment of Vietnam’s annual overall economy, 2018-23 |
Implications and key takeaways
This article has presented a mixed picture of performance in governance and public administration within the eight dimensions that PAPI measures at the national aggregate level in 2023. It has also highlighted areas of citizens’ greatest concern, particularly regarding their household situation and the national economic situation, which reflect Vietnam’s challenging socio-economic conditions during the year.
As mentioned above, improvements were seen in the two dimensions of Control of Corruption in the Public Sector and E-Governance while the two dimensions of Public Service Delivery and Environmental Governance remained stable. However, the four remaining dimensions saw declines. Further examination of survey results on Transparency in Local Decision-making revealed that transparency in areas of citizens’ interest is crucial to effective citizen-centric public governance. Nevertheless, the indicators on transparency of poverty lists and of commune budget and expenditure in 2023 revealed areas that require further attention from central and local government agencies. Additionally, while some improvement in access to state policy information was evident, transparency in land use plans and land price frames requires a stronger boost in 2024 and beyond to move away from the status quo of the past two years. Having noted that, local governments should take greater initiatives in preventing corruption in state employment and public service delivery to eliminate corruption in everyday government-citizen interactions.
Furthermore, in terms of the issues of greatest concern and the overall sentiment of household and national economic situations, more Vietnamese citizens felt anxious about the economic picture in 2023 than before, aside from 2021. While the overall sentiment of the economy remains optimistic, increasing numbers of respondents viewed their household economic situations negatively in 2023, while a high number of them implied that poverty reduction, job creation and higher economic growth should be prioritized by the State. Additionally, fewer respondents experienced improvements in their household economic conditions, particularly ethnic minorities and the poorest segments of the population. Even higher-income respondents were more pessimistic than in the past. This negativity is manifested in an overall increasing sentiment that economic growth was one of the top three issues for the national government to address in the year(s) to come. While people may attribute their household economic situation to a mixture of luck and policy, the overall economy may be more linked to government performance in citizens’ eyes.-
[1] The Vietnam Provincial Governance and Public Administration Performance Index (PAPI) is a policy monitoring tool that assesses citizen experiences and satisfaction with government performance at the national and sub-national levels in governance, public administration and public service delivery. Following the initial pilot in 2009 and a larger survey in 2010, the PAPI survey has been implemented nationwide each year since 2011. In total, 197,779 Vietnamese citizens nationwide have been directly interviewed for PAPI since 2009. PAPI measures eight dimensions: Participation at Local Levels, Transparency in Local Decision-making, Vertical Accountability Toward Citizens, Control of Corruption in the Public Sector, Public Administrative Procedures, Public Service Delivery, Environmental Governance, and E-Governance. PAPI is the result of collaboration between the Center for Community Support and Development Studies (CECODES), Real-Time Analytics and the United Nations Development Program (UNDP), with the support for fieldwork coordination from the Vietnam Fatherland Front’s Central Committee and its provincial to grassroots chapters since 2009. For more information about the PAPI research and reports, visit www.papi.org.vn.
[2] See Voice of Vietnam (July 3, 2023). Vietnam shows strong resolve to root out corruption. Available at: https://english.vov.vn/en/politics/domestic/vietnam-shows-strong-resolve-to-root-out-corruption-post1030220.vov. Accessed on January 10, 2024.
[3] See The People (December 12, 2023). Chống tham nhũng: Cuộc chiến còn cam go. [Anti-corruption: An arduous battle]. Available at: https://nhandan.vn/chong-tham-nhung-cuoc-chien-con-cam-go-post789881.html. Accessed on January 10, 2024.
[4] The poverty lists (or the poor lists) are lists of low-income households whose income falls below the poverty line proposed by the Ministry of Labor, Invalids and Social Affairs on a five-year basis for urban and rural populations. For the 2021-25 period, the poverty line is VND 2 million per month in urban areas and VND 1.5 million per month in rural areas (see Government of Vietnam, January 27, 2021). It is important to note that measuring income for workers outside the formal sector, comprising most of the poor, is challenging. Therefore, local authorities have considerable discretion in compiling lists of the poor. They must also ensure that the lists conform to budgets, so income is not the only criterion. Nonetheless, citizens’ participation in nominating the poorest households in their communities is prescribed by law.
[5] See the timeline of the incidence of mass fish deaths along the central coast of Vietnam due to chemicals discharged by the Formosa Plastics Group into the sea offshore of four provinces (Ha Tinh, Quang Binh, Quang Tri and Thua Thien-Hue): https://vietnamnet.vn/en/panoramic-view-of-mass-fish-death-in-central-vietnam-E155823.html and on Voice of Vietnam (October 1, 2016) at: https://english.vov.vn/en/society/over-19000-vietnamese-jobs-lost-to-formosa-mass-fish-deaths-332561.vov.